
The Reliability Gap: Reconstructing Lazard’s LCOE+ v19.0 Data to Price Real Backup Capacity, Technology by Technology
THE SENECA CENTER FOR ENERGY AND CRITICAL MINERALS POLICY RESEARCH PAPER

By T.L. Headley, MBA,
President, The Hedley Company
Founder and Senior Vice President, The Seneca Center for Energy & Critical Minerals Policy
I. Executive Summary
Lazard’s 2026 Levelized Cost of Energy+ report (Version 19.0, released July 2026) puts unsubsidized wind and solar on top of its headline cost chart again this year. That chart carries a structural flaw Lazard discloses but does not correct: it prices generation at the plant fence line and stops there, leaving out the cost of keeping the lights on when the wind stops and the sun sets. Lazard partially addresses this in a supplemental section — its Cost of Firming Intermittency analysis — but applies that fix only to wind, solar, and their storage pairings. Gas, coal, and nuclear are left unfirmed in the same comparison, despite Lazard’s own text acknowledging that conventional generation carries real reliability risk from fuel supply, pipeline deliverability, and forced outages.
This paper does three things. First, it lays out Lazard’s published numbers plainly. Second, it documents the specific methodological choices that flatter intermittent generation in the comparison — most notably a new-build coal figure that Lazard admits is five-year-old data run through an inflation adjustment, not current market pricing. Third, and most importantly, it takes Lazard’s own firming-cost formula and its own published reliability data — the ELCC and capacity-accreditation values grid operators report for every generation type, not just renewables — and applies that formula uniformly across the entire generation stack. The result is a reliability-adjusted LCOE that treats every technology by the same yardstick Lazard already built.
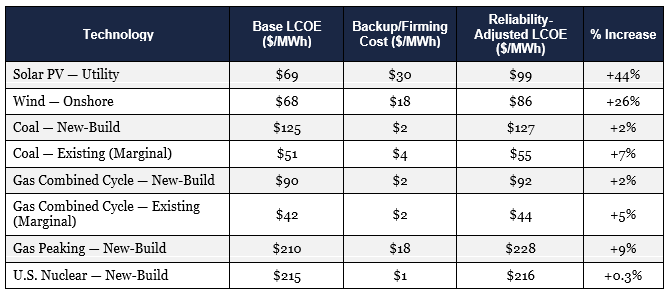
The finding is not subtle. Once backup capacity is priced in at the same standard for everyone, utility-scale solar’s cost rises by roughly 44 percent and onshore wind’s by roughly 26 percent. Coal’s rises by less than 2 percent for new-build and under 7 percent for existing plants. Gas combined-cycle moves by roughly 2 to 5 percent. Nuclear barely moves at all. The gap Lazard’s chart shows between renewables and everything else narrows sharply, and in several regional cases documented later in this paper, it closes altogether.
II. Lazard’s Published Numbers
Lazard’s headline comparison (LCOE Comparison, Version 19.0) reports the following unsubsidized levelized costs, presented here as the average of Lazard’s published low and high case for each technology:
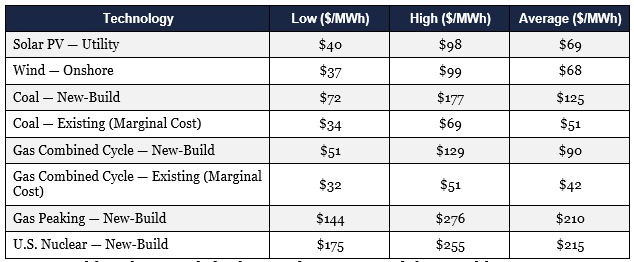
Every one of these figures excludes, by Lazard’s own written definition of the LCOE perimeter, “bulk transmission, local distribution, reliability costs (including capacity/reserve margin compliance), ancillary services, system balancing and congestion management, interconnection and network upgrades.” That exclusion applies equally to every technology in the table above. It matters far more for some than others, which is the subject of Section IV.
III. The Problems with Lazard’s Data
1. The new-build coal figure is not current data.
A footnote on Lazard’s flagship chart states the new-build coal (and geothermal) LCOE “reflects Lazard’s LCOE v14.0 results adjusted for inflation,” because Lazard says it lacks sufficient observable current-market coal construction data. Version 14.0 dates to roughly 2020. The $125/MWh average coal figure appearing in a July 2026 report is a six-year-old capital-cost estimate carried forward through an inflation index, not a benchmark built from projects in development today. Every other technology in the chart is built from current-year data. Coal is not, and the report says so in its own footnotes.
2. Firming costs are calculated for renewables and left out for everyone else.
Lazard’s Cost of Firming Intermittency section states plainly that its results are “drawn without any regional adjustment or offsetting firming charge applied to the CCGTs themselves,” and that gas-fired generation is “not separately modeled in the firming analysis.” In the same section, Lazard acknowledges conventional generation is “increasingly subject to more granular — and, in some cases, asset-specific — capacity accreditation as grid operators seek to reflect fuel security, pipeline deliverability, outage risk and historical performance.” Lazard knows gas, coal, and nuclear carry reliability risk that grid operators price. It priced that risk for renewables and not for anyone else, in the same chart used to declare renewables cost-competitive.
3. The core LCOE excludes system costs by design, and Lazard says so.
Lazard’s own “Scope of Lazard’s LCOE Metric” appendix states the LCOE “excludes certain project- and geography-specific costs and system and grid-level costs that enable a functioning power grid.” Its “Does Not Say” page states outright that the report does not identify “what total system costs are for 1 MWh of incremental electricity” and does not identify “the optimal mix of renewables, conventional generation and storage.” These are not hidden admissions. They sit on the page directly beneath the headline chart that gets screenshotted and circulated without them.
4. Where Lazard does price firming, the results already undercut its own headline framing.
In Lazard’s regional firming tables, several wind-plus-storage and solar-plus-storage combinations land at $130 to $167/MWh once firmed to the local grid operator’s reliability standard — matching or exceeding the high end of Lazard’s own gas combined-cycle range in the same regions. Lazard’s executive summary still describes renewables as “broadly cost-competitive” with CCGTs after firming. The regional data in its own appendix tells a closer story than the summary language suggests.
5. The coal fuel price assumes no basin, and Appalachian coal likely beats it on every count.
Lazard’s coal fuel cost is stated only as $1.47/MMBtu (new-build) and $1.90–$2.95/MMBtu (existing), with no basin identified and no sourcing citation given — a gap made more conspicuous by how granular Lazard gets with regional Net CONE and ELCC data elsewhere in the same report. Converted at a Powder River Basin heat content of 8,800 Btu/lb, $1.47/MMBtu implies roughly $26/ton, which reads as a PRB-anchored assumption. Northern and Central Appalachian coal is a materially different fuel on three counts Lazard’s flat figure erases:
● Higher heat content — NAPP and CAPP coal typically runs 11,000–13,500 Btu/lb against PRB’s 8,800 Btu/lb, meaning less tonnage has to be burned to hit the same heat input and generate the same MWh.
● Better combustion efficiency — lower moisture and ash content in NAPP/CAPP coal supports more complete combustion and a better heat rate than PRB’s sub-bituminous coal in plants designed or optimized for it, inside the same 8,750–12,000 Btu/kWh range Lazard’s own heat rate assumption spans without differentiating by basin.
● Shorter haul distances — PRB coal typically moves 1,000 to 1,500-plus miles by unit train to reach plants in the Midwest, Southeast, or Appalachian region, while NAPP and CAPP coal frequently serves plants within a few hundred miles, in some cases at or near mine-mouth. Lazard’s fuel price line captures the commodity cost, not delivery, so this advantage does not appear anywhere in the LCOE at all.
Stacked together, these three factors point the same direction: Appalachian coal likely outperforms the generic, PRB-leaning fuel assumption driving Lazard’s $125/MWh new-build coal average. If anything, that figure — already built on stale v14.0 capital-cost data per Item 1 above — is conservative on the fuel side for Appalachian-basin generation specifically, understating how competitive an Appalachian coal plant’s delivered cost of energy actually is relative to the number Lazard publishes.
Coal Basin Comparison (Illustrative)
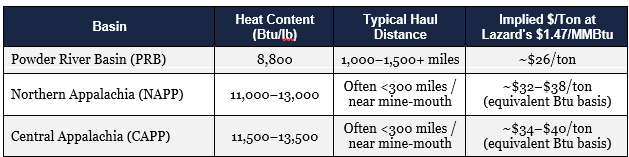
The NAPP/CAPP figures above are equivalent-Btu conversions of Lazard’s own $1.47/MMBtu assumption, shown for comparison only — they are not Lazard’s numbers and are not claimed to be. They illustrate that the same $/MMBtu figure implies a higher $/ton price for higher-Btu Appalachian coal, which is a separate question from what Appalachian coal actually costs delivered; that figure depends on contracted mine pricing and rail rates Lazard does not publish and this paper does not claim to know.
IV. Rebuilding the Dataset: A Reliability-Adjusted LCOE
The correction applied here is not a new methodology. It is Lazard’s own methodology, applied to every technology instead of four of them.
Methodology
Lazard’s Cost of Firming Intermittency section defines a Levelized Firming Cost as the cost of covering the gap between a resource’s nameplate capacity and its accredited, reliable contribution to peak demand, using each grid operator’s own Effective Load Carrying Capability (”ELCC”) or capacity accreditation value and its Net Cost of New Entry (”Net CONE”). Lazard’s own formula, reproduced from its methodology page, is:
Levelized Firming Cost ($/MWh) = [Nameplate Capacity × (1 – Reliability Factor) × Net CONE ($/kW-month) × 12] ÷ [Nameplate Capacity × Capacity Factor × 8,760 hours]
This paper applies that same formula to coal, gas combined cycle, gas peaking, and nuclear, using accreditation values Lazard’s own report publishes in its Appendix B market-overview tables for conventional generation, alongside the ELCC values it already uses for wind and solar. Because CAISO and SPP publish conventional-generation accreditation on a unit-specific basis without a released percentage, this analysis averages the accreditation and Net CONE values across the grid operators that do publish a comparable number, producing one national reliability factor and one national Net CONE for the calculation below. This is a first-order national approximation, not a region-matched figure; Lazard’s own regional tables, cited in Section III, show the gap can run wider or narrower by market.
Reliability Factors Used (Source: Lazard LCOE+ v19.0, Appendix B)
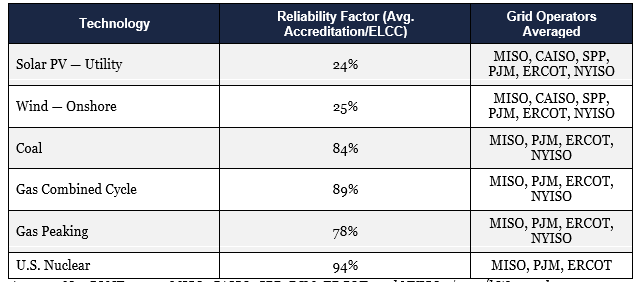
Average Net CONE across MISO, CAISO, SPP, PJM, ERCOT, and NYISO: $7.32/kW-month ($87.86/kW-year), per Lazard’s Appendix B market-overview table.
The Reliability-Adjusted Dataset
The Key Finding
Once every technology is held to the identical reliability standard Lazard already built for renewables, the cost gap that drives the entire LCOE+ narrative compresses hard. Solar’s true cost of reliable delivery lands closer to $99/MWh than the $69/MWh headline. Wind lands closer to $86/MWh than $68/MWh. Coal, gas combined cycle, and nuclear barely move, because they were already built to run when called on and require comparatively little backup capacity to guarantee that they will. The reliability penalty Lazard’s own data assigns to intermittent generation is the cost that gets left off the chart everyone quotes.
V. SWOT — The Reliability-Adjusted Framework
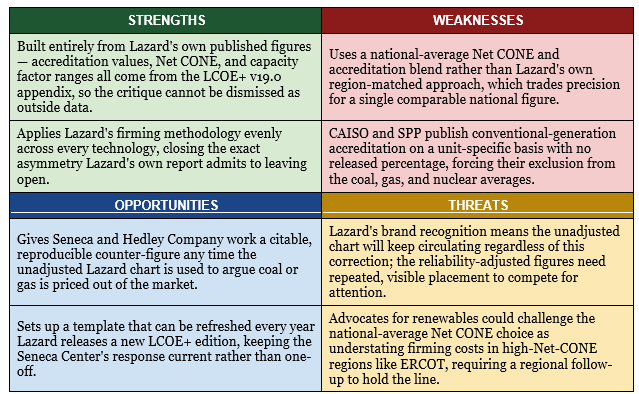
VI. Implications for Ratepayers and Policymakers
● West Virginia families and businesses pay the bill for whatever generation mix state and regional planners approve. A cost comparison that omits backup capacity understates what ratepayers actually owe for reliable, around-the-clock power.
● Grid operators already charge for this gap through capacity markets and Net CONE-based mechanisms. The reliability-adjusted figures in this paper are not a new cost; they are a cost that already exists on ratepayer bills and simply does not appear in Lazard’s headline chart.
● Retirement decisions for existing coal and gas plants weighed against new wind or solar should be evaluated against the reliability-adjusted figures in Section IV, not the unadjusted LCOE, because the unadjusted comparison mismatches a firm resource against an unfirmed one.
● Employment and rail, steel, and supply-chain activity tied to coal and gas generation depend on plants continuing to run. A cost comparison that overstates renewables’ advantage relative to reliable generation feeds retirement decisions that put those jobs at risk on the basis of an incomplete number
VII. Methodology Notes and Limitations
● This analysis uses national-average reliability factors and a national-average Net CONE. Lazard’s own regional tables show meaningful variation by market — ERCOT’s Net CONE, for example, runs nearly double MISO’s. A region-matched version of this analysis would show a wider reliability penalty for renewables in some markets and a narrower one in others.
● CAISO and SPP publish conventional-generation accreditation on a unit-specific basis without a released aggregate percentage. Coal, gas, and nuclear reliability factors in this paper are averaged across the four grid operators that do publish a comparable figure (MISO, PJM, ERCOT, and NYISO for coal and gas; MISO, PJM, and ERCOT for nuclear).
● Capacity factors used for the backup-cost calculation are the midpoint of Lazard’s own published low/high case for each technology, consistent with how the base LCOE averages in Section II were derived.
● This paper does not attempt to price system-level costs beyond firming — transmission upgrades, interconnection queues, and distribution costs remain outside scope for every technology, exactly as they are in Lazard’s own LCOE perimeter.
VIII. Sources
● Lazard, “Levelized Cost of Energy+,” Version 19.0 / Levelized Cost of Storage Version 11.0, July 2026.
● All reliability factors, Net CONE values, and capacity factor ranges cited in this paper are drawn directly from Lazard’s LCOE+ v19.0 report, Sections II and Appendix B.
The Hedley Company
The Hedley Company | 169 Raceview Drive, Ona, WV 25545 | tlheadley@hedleycompany.com | Ph. 681.356.1776